Katie Hoeck is SkyTruth’s newest intern. Katie is a senior at Shepherd University, majoring in mathematics and minoring in physics. She is a self-admitted 7 year senior, going through various changes in her major over the course of a few years. She started out as a biochemistry major, then switched to chemistry and physics, before deciding at last on mathematics. I asked Katie what she wants to be when she grows up, and she told me that she’d love to become a researcher, more specifically, an alternative energy researcher, concentrating on green technology. Not a bad gig!
Katie lives in Martinsburg, WV with her two dogs Harley and Rocky and her cat, Muon. Being the Office Administrator here at SkyTruth, and having NO clue what a Muon is, I asked her to please explain the cat’s name. She said that a muon is an unstable atomic particle with the same charge as an electron, but which has 206 times the mass and a half-life of 2.2 microseconds.
For her work here at SkyTruth, Katie is clustering data such as geographic coordinates, dates, times, volumes and types of offshore-oil pollution incidents from 20 years of pollution reports acquired from the NRC. An analysis of the clustered data will determine if any interesting and pertinent information is contained therein.
She found out about SkyTruth last year through Dr. Jeffrey Groff at Shepherd after he met with SkyTruth’s Chief Technical Guru, Paul Woods. Dr. Groff had the idea of using a model Raven Drone to fly over water for pollution mapping using aerial photography, which sparked Katie’s interest. This summer, Joe Jefferson, Shepherd’s Director of Cooperative Education, sent out information regarding internships at SkyTruth. Katie came in to meet with us and then things just fell right into place.
When I asked Katie what it was the she wants to get out of SkyTruth, she quickly answered that she wants the experience of applying what she’s learned in her field to the real world. She’s taken the math and science classes and done several research projects, but has yet to apply her knowledge in a professional setting. At SkyTruth, she is being given the opportunity to take what she’s learned in the classroom and apply it to practical matter.
SkyTruth has been looking over industry-reported data from FracFocus.org to see what we can learn about hydraulic fracturing activity across the United States. One topic we were curious about was the volume of water being used by fracking operations. According to report on modern shale gas prepared for the U.S. Dept. of Energy and others by the Groundwater Protection Council (one of the managers of the FracFocus website), “[t]he amount of water needed to drill and fracture a horizontal shale gas well generally ranges from about 2 million to 4 million gallons, depending on the basin and formation characteristics.” While that is a lot of water, does the data voluntarily reported match this estimate, and what does that look like repeated thousands of times across the U.S.?
We ranked the leading operators based on the number of reported wells with a Hydraulic Fracturing Fluid Product Component Information Disclosure on FracFocus.org and this is what we found:
Rank*
State
Fracks Reported
Average (in gallons)
Total Used
% of Total Water Use
1
Texas
11,922
2,573,701
30,683,667,301
47%
2
Colorado
4,205
1,242,158
5,223,274,238
8%
3
Pennsylvania
1,884
4,328,886
8,155,620,871
12%
4
North Dakota
1,353
2,010,931
2,720,789,835
4%
5
Arkansas
1,305
5,223,972
6,817,283,249
10%
6
Wyoming
1,131
761,048
860,745,353
1%
7
Oklahoma
1,113
3,756,270
4,180,728,158
6%
8
Louisiana
930
5,341,088
4,967,211,610
8%
9
New Mexico
789
663,868
523,791,968
0.8%
10
Utah
783
352,288
275,841,828
0.4%
11
California
314
167,507
52,597,101
0.1%
12
West Virginia
178
4,720,082
840,174,633
1.3%
N/A
All Other States
432
1,383,994
597,885,252
0.9%
*by # of fracks
TOTAL
26,339
2,501,984
65,899,611,396
100%
Looking at these numbers, we find that the industry estimate is fairly accurate but it varies significantly by state. The main variable for the volume of water is the geology of the basin being fracked. Stimulating a conventional shallow well for oil in the Coconino formation of Utah takes much less than an unconventional well in the Marcellus Shale of Pennsylvania, and in some cases, like California’s Monterrey Shale, are ideally suited for low-volume fracking with an average of only 167,506 gallons.
But even with small fracks, water volumes in the hundreds of thousands of gallons add up to 65.9 BILLION gallons, so we decided to see what that total volume would look like in the real world. However, a few notes about the data:
Our analyses are based only on the information which is voluntarily reported by participating companies. We have posted before on the lack of complete disclosure on FracFocus, but for measuring quantities, we can easily assume that our calculations will be conservative.
Some fracking jobs reuse “produced water” from other jobs, but because it is listed by so many different names, we have not differentiated the amount recycled.
With these considerations in mind, you can see that between January 2011 and August 2012, a total of 20 months, the United States used at least 65.9 billion gallons of water to frack for oil and gas, with Texas accounting for almost half of all water use. But as big as these numbers are, what does that look like in the real world?
Visualizing 65.9 Billion Gallons of Frackwater:
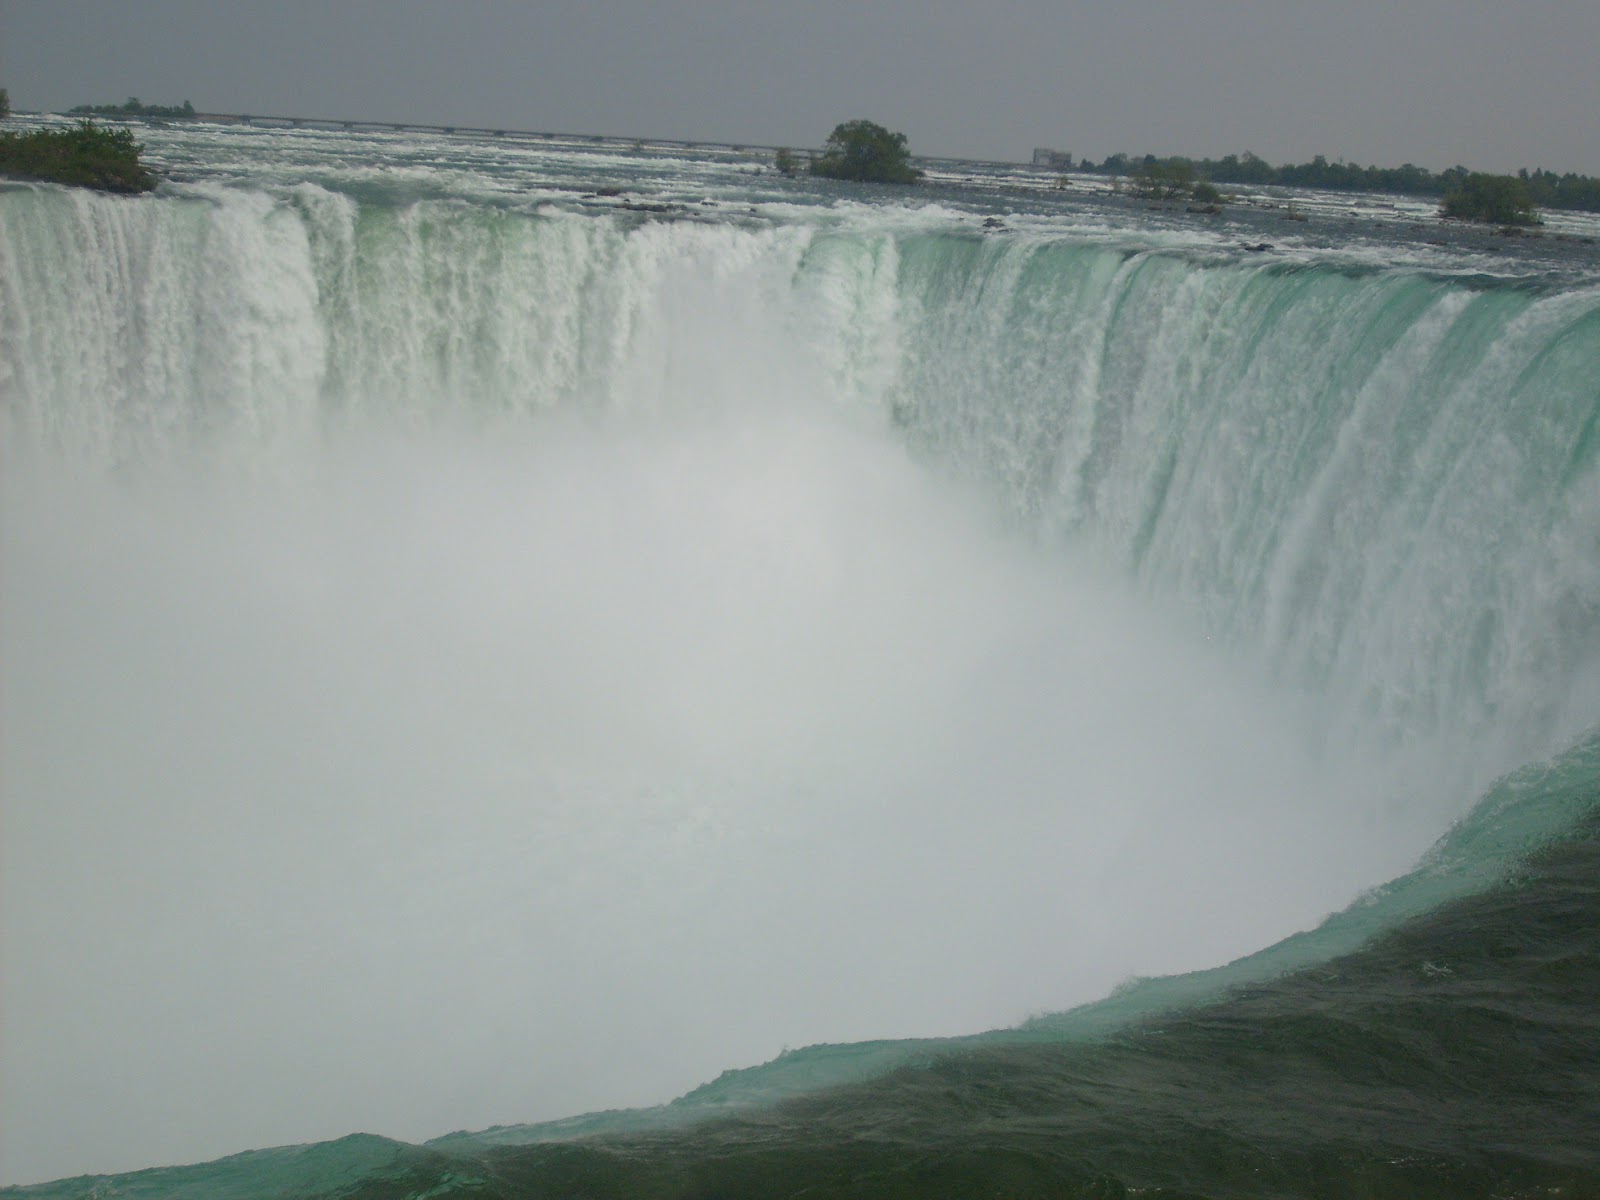
Horseshoe Falls as seen from the Canadian side. Wikipedia Commons.
To put in perspective the immense volume that this is, we turned our attention to an iconic feature that epitomizes massive quantities of water: Niagara Falls. Standing 167 feet tall between New York, U.S.A. and Ontario, Canada, at least 100,000 cubic feet water flows over these cataracts every second during the daylight hours of summer. (As opposed to being diverted to produce hydro-electric power, an international treaty mandates that at least 100,000 cf/s of flow be maintained during the tourist season to ensure “an unbroken curtain of water.”)
The minimum rate of flow that is guaranteed to tourists translates to three-quarters of a million gallons per second. We asked, at this rate, how long would it take for 65.9 billion gallons to thunder over the ledge and onto the Maid of the Mist below? Let’s do the math…
1 cubic foot= 7.48 gallons so 100,000 cf/s=748,052 gal./second

748,052 g/s x 60 seconds = 44,883,120 gal./minute

44.88 million gal./min. x 60 min. per hour= 2,692,980,000 gal. /hr. = 100,000 cf/s
At this rate, we can now see it would take over a day for Niagara Falls to represent the 65.9 billion gallons of water the United States has been drawing from rivers, lakes, and streams, trucking or piping to wellpads, lacing with toxic chemicals, mixing with tons of sand (check back in a few days to find out how much sand and where it comes from), and injecting deep into the ground to get oil and gas.
Keep in mind that all of this water either stays in the ground OR returns to the surface as an industrial waste product that is sometimes mildly radioactive, and that is just based on what has been reported to FracFocus. Now that is a LOT of water…
There are many videos of Niagara Falls, but this has a particular SkyTruthiness to it since we are always interested in remote sensing tools like this for obtaining the aerial imagery that defines SkyTruth. (Start at 1:20 for the launch of the RC craft)
https://skytruth.org/wp-content/uploads/2012/09/Horseshoe_from_Ontario_003.jpg240320David Manthoshttps://skytruth.org/wp-content/uploads/2020/11/SkyTruth-Header-Logo-C.pngDavid Manthos2012-09-14 08:09:002023-03-02 11:28:42Water, Water, Everywhere: 20 Months of Frackwater in the U.S.
The NOAA aerial survey imagery shot in the wake of Hurricane Isaac really is helpful for assessing storm impacts. Here’s another example, showing the flooded Stolthaven chemical facility along the Mississippi River near Braithwaite, Louisiana. Someone – we think it must be the company, based on the wording – filed a pollution incident report with the National Response Center on September 11. This report popped up in our handy SkyTruth Alerts system; it claims nearly 200,000 gallons of chemicals were released, mostly ethylene glycol but including several other nasty things like styrene, xylene and cancer-causing benzene.
Nearby residents have been evacuated, and some have filed suit against the company.
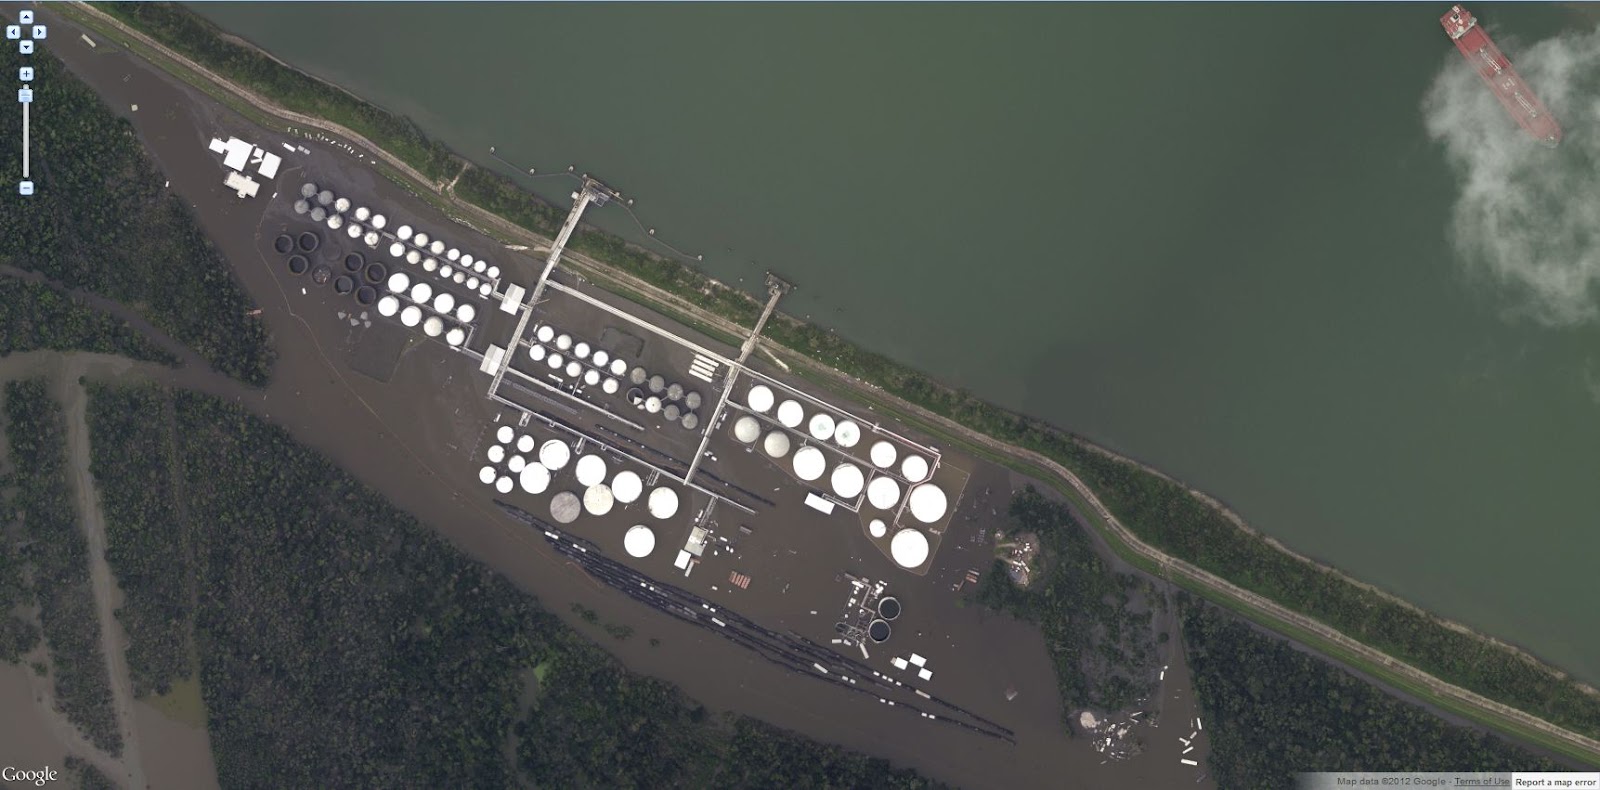
Here’s what the facility looked like when NOAA flew over on August 31:
NOAA aerial survey photography showing flooded Stolthaven chemical facility near Braithwaite, LA on August 31.
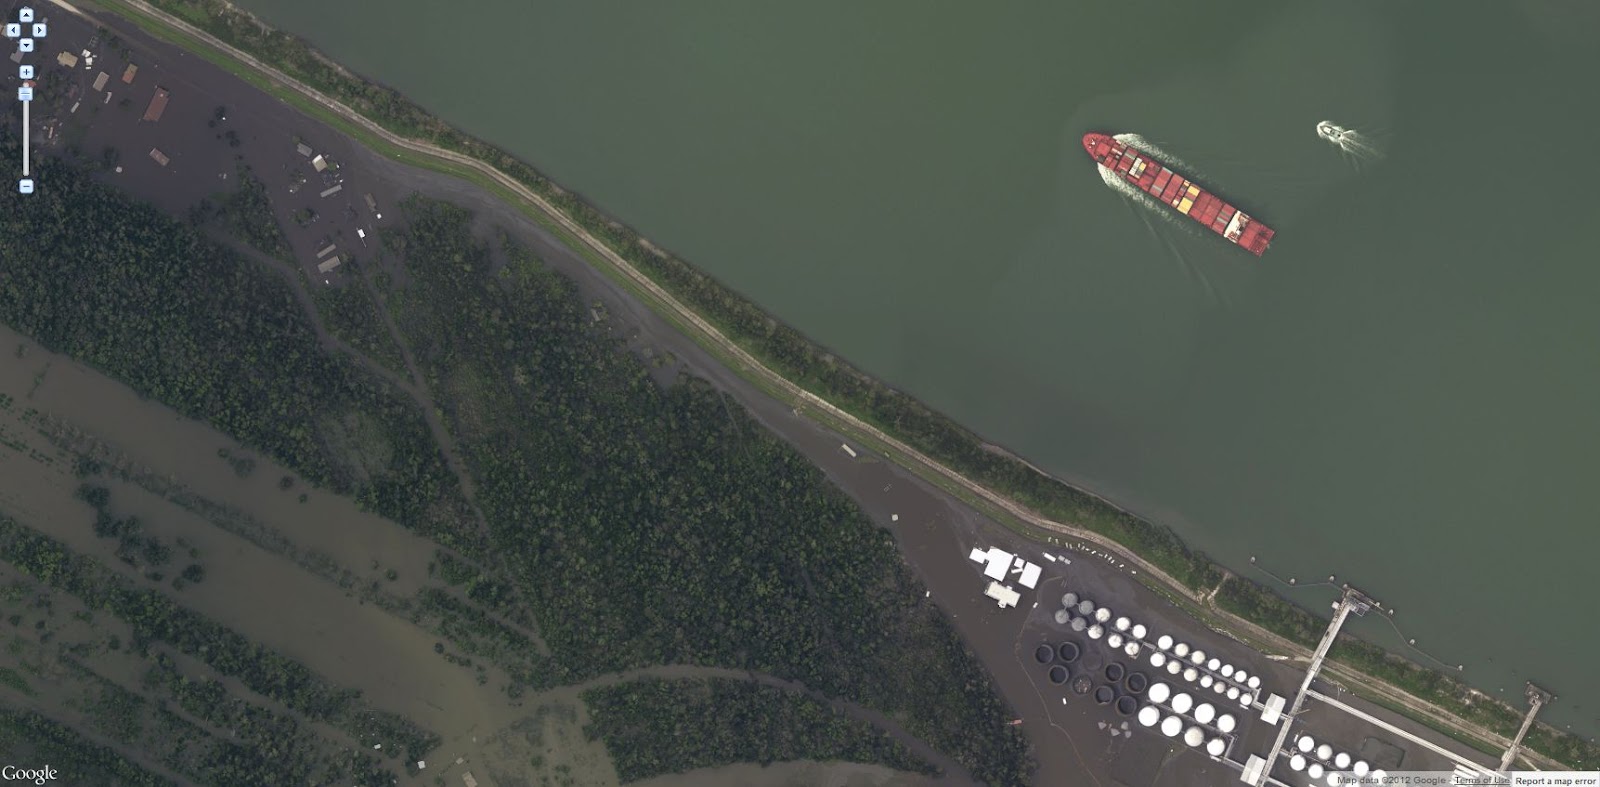
Focusing on the northwest end of the site, we can see what appear to be slicks and/or sheen, possibly oil or other chemicals, originating from the round storage tanks and flowing downstream toward homes along English Turn Road:
Slicks and sheen apparently migrating downstream from the Stolthaven facility (lower right) toward flooded homes (upper left).
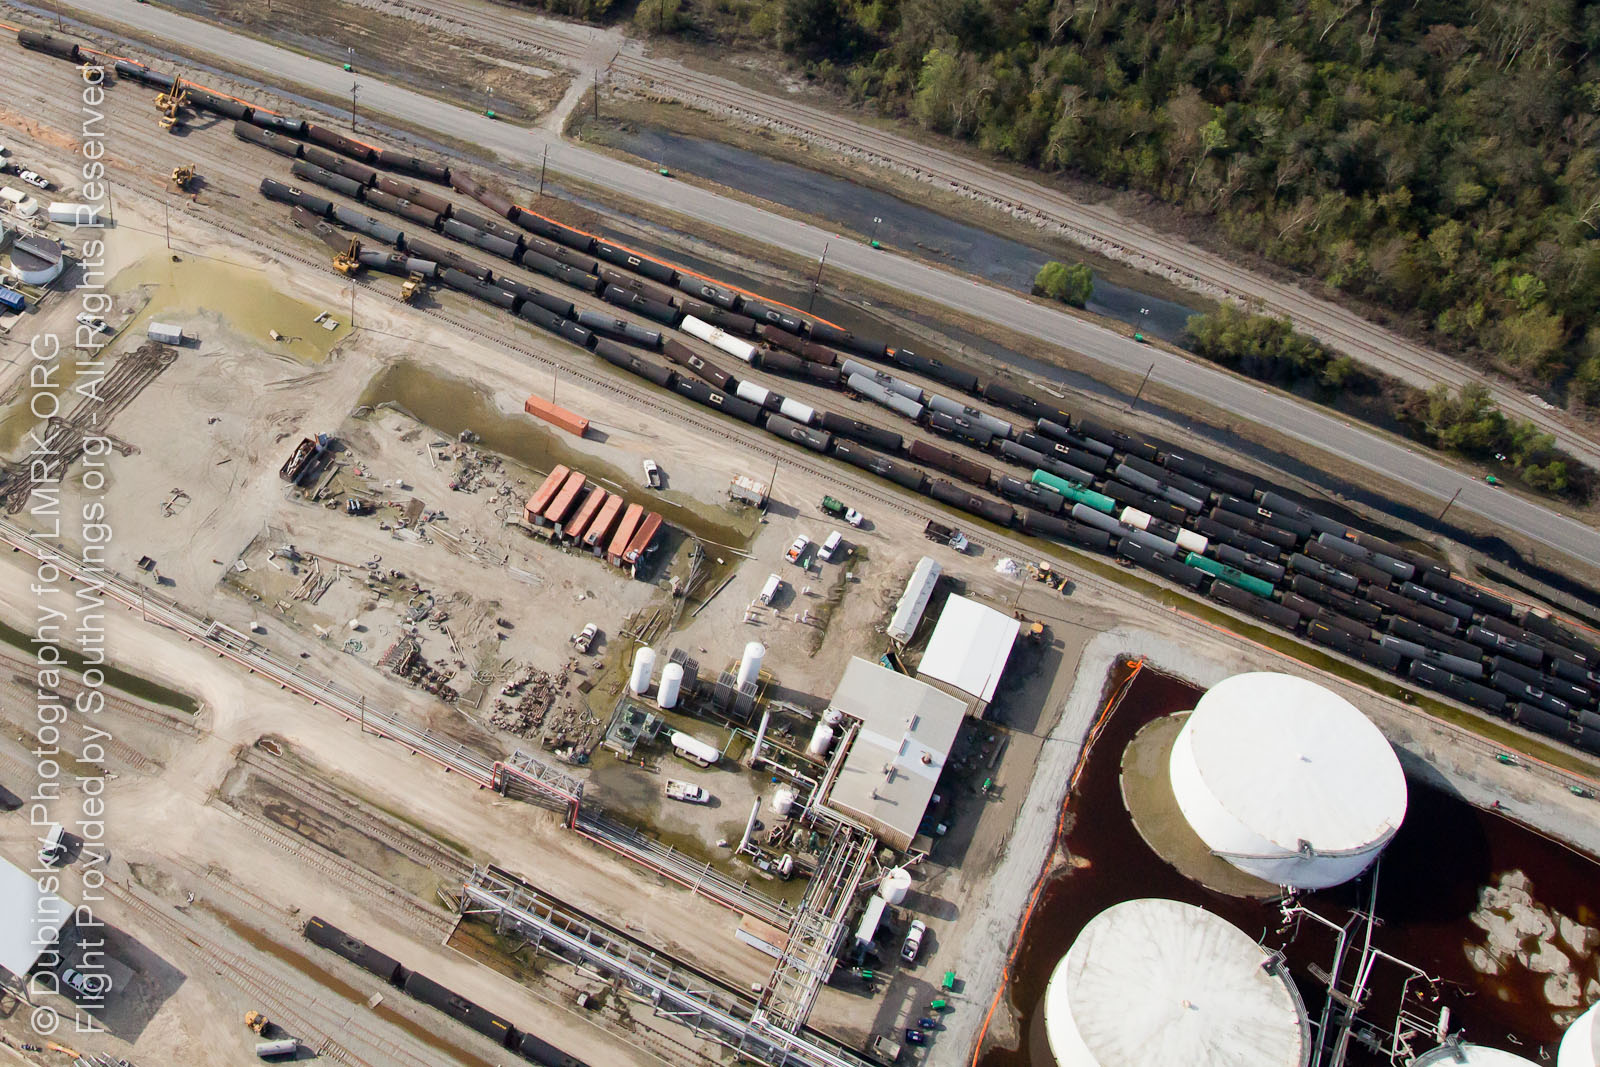
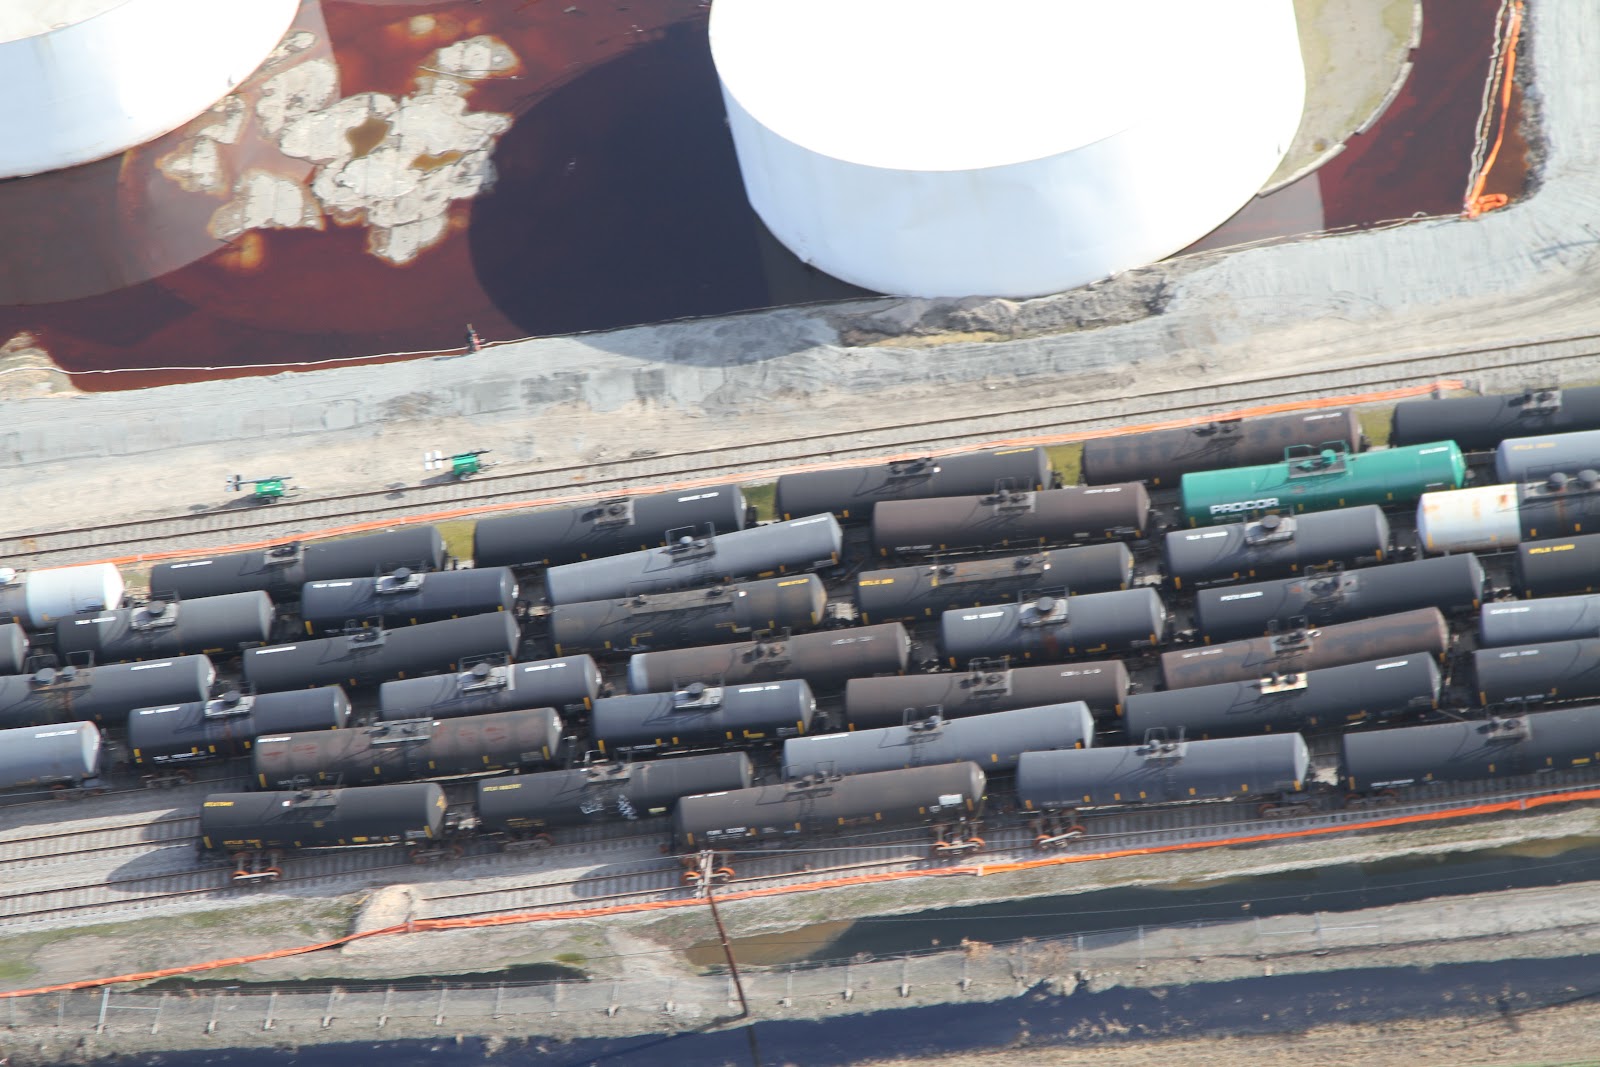
The flooding derailed tanker cars, damaged storage tanks, and caused other problems on the site. On a Gulf Monitoring Consortium overflight on September 10, photographer Jeffrey Dubinsky captured a series of low-altitude pics illustrating some of this damage, like this storage tank apparently pushed off its supporting foundation:
Air photo of Stolthaven chemical facility taken during Gulf Monitoring Consortium overflight on September 10, 2012, courtesy of Jeffrey Dubinsky. See more of Jeffrey’s pics from this flight here.
Jonathan Henderson from Gulf Restoration Network was also on the flight, and caught some great pics too, including this closeup of the dislodged tank:
Another view of the dislodged tank, courtesy of Jonathan Henderson of the Gulf Restoration Network (see more of his pics from the September 10 overflight).
Isaac was certainly a big storm, but clocked in as a relatively mild Category 1 hurricane. You would think that by now, major industrial facilities planted in the middle of Hurricane Alley would be better able to withstand such predictable storm exposure. But I guess you’d be wrong….
https://skytruth.org/wp-content/uploads/2020/11/SkyTruth-Header-Logo-C.png00John Amoshttps://skytruth.org/wp-content/uploads/2020/11/SkyTruth-Header-Logo-C.pngJohn Amos2012-09-13 20:44:002022-12-29 10:48:25Possible Contamination from Stolthaven Chemical Facility, Braithwaite, LA
As in the aftermath of previous major storms, NOAA has flown aerial photography surveys of coastal and flooded areas, and is making the pics publicly available. They’ve embedded this very detailed imagery in an easy-to-use interactive map. You can enter a location name (city, state) and zoom in and pan around to check out your specific area of interest. Kudos to NOAA for providing this important visual information!
Here’s an example, looking at the flooded ConocoPhillips Alliance refinery along the Mississippi River south of Belle Chasse, Louisiana. Slicks are visible, although they appear to be contained onsite at the facility when the NOAA photos were taken. Jonathan Henderson at the Gulf Restoration Network blogged about this spill on Sunday:
Take a look at this NOAA photography, and let us know if you see anything interesting. We’re eyeball-limited here, and can always use some help skytruthing, especially when a great dataset like this is available.
https://skytruth.org/wp-content/uploads/2012/09/SkyTruth_NOAA-BelleChasse-ConocoPhillipsAllianceRefinery-detail.jpg316640John Amoshttps://skytruth.org/wp-content/uploads/2020/11/SkyTruth-Header-Logo-C.pngJohn Amos2012-09-06 18:40:002023-01-18 16:47:43Post-Isaac Aerial Survey Photography Now Available From NOAA