This MODIS / Terra color satellite image of the Gulf was taken at 16:30 hours UTC (1:30 pm Central time). Isaac is now a Category 1 hurricane, with sustained winds of 75 mph, moving steadily toward the northwest at 10 mph. It’s expected to make landfall along the Louisiana coast tonight. Right now it’s passing through the offshore oil fields, throwing a right hook at the platforms and pipelines on the east side of the Delta from Breton Sound to Dauphin Island and Mobile Bay. That northeast quadrant of the storm is where the strongest winds and biggest waves usually occur. Data buoys in that area are now reporting 18 foot waves and surface wind speeds of 60 knots (69 mph):
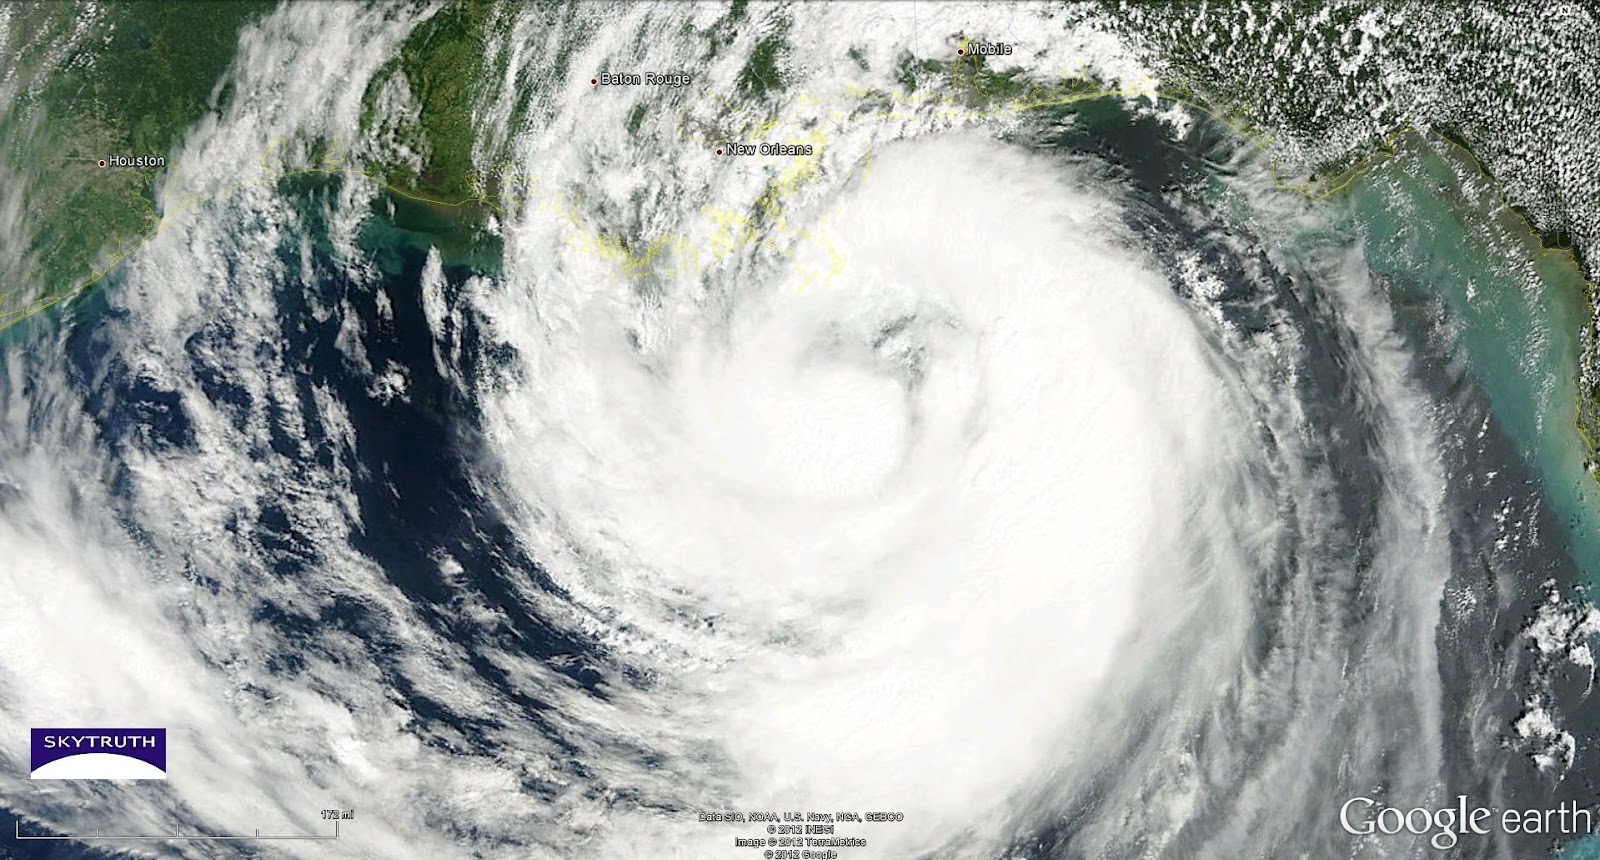
MODIS / Terra satellite image taken at 1:30 pm Central time on August 28, 2012. Hurricane Isaac, looking more organized and “wound up” than in previous images, should make landfall tonight.
Same image with oil and gas platforms and pipelines shown in orange.
https://skytruth.org/wp-content/uploads/2012/08/SkyTruth-Isaac-28aug2012-1630z-GOES.jpg344640John Amoshttps://skytruth.org/wp-content/uploads/2020/11/SkyTruth-Header-Logo-C.pngJohn Amos2012-08-28 20:01:002023-01-18 16:40:01Hurricane Isaac Heading for Shore – MODIS Image
Isaac is still a strong tropical storm with winds at 70 mph, now hitting the offshore oil fields in the Gulf of Mexico. Isaac is by no means a pushover, posing a serious threat of flooding to New Orleans and surrounding areas inland, but it is far weaker than Hurricanes Katrina and Rita which slammed the oil fields as Category 5 storms in 2005, destroying dozens of platforms, breaking hundreds of seafloor pipelines, and spilling millions of gallons of crude oil.
Here’s the latest forecast track for the storm. Oil and gas infrastructure shown in orange. The predicted path for Isaac’s center is shown as a black line, with the “cone of uncertainty” for the path shown in purple. This does not show the extent of tropical-storm-force winds thatt extend outward for a considerable distance from the storm’s center:
National Hurricane Center forecast storm track for Isaac, August 28, 2012 (Advisory #29). Orange dots and lines are offshore oil and gas platforms and pipelines.
Weather satellite image of Isaac – August 28, 2012 at 6:45 am Central time.
The latest forecast from the National Hurricane Center at NOAA has shifted the predicted track of Tropical Storm Isaac further to the west, putting it on line to pass right over New Orleans. Of course, this could still change before Isaac makes landfall, predicted for sometime tomorrow evening. Maximum sustained winds are currently 70 miles per hour, but Isaac is predicted to reach hurricane strength tonight or tomorrow morning.
Here’s a map using the latest forecast track (from Advisory #27, issued at 4pm Central time today). As with yesterday’s maps, the likely path of the center of the storm is shown as a black line; the “cone of uncertainty” for the storm track is shown in purple, and offshore oil and gas platforms and pipelines are orange dots and lines:
National Hurricane Center forecast storm track for Isaac, August 27, 2012 (Advisory #27). Orange dots and lines are offshore oil and gas platforms and pipelines.
https://skytruth.org/wp-content/uploads/2012/08/SkyTruth-Isaac-27aug2012-forecast-platforms-detail.jpg352640John Amoshttps://skytruth.org/wp-content/uploads/2020/11/SkyTruth-Header-Logo-C.pngJohn Amos2012-08-27 21:23:002023-01-18 16:33:04Isaac Forecast Track: Shifting West
The latest forecast for Tropical Storm Isaac shows it likely headed into the Gulf of Mexico along a track slightly further west than earlier forecasts. That would have it passing through an area of dense offshore oil and gas infrastructure. While it’s currently still a tropical storm, it’s predicted to strengthen over warm Gulf waters, possibly reaching Category 2 strength. That’s significantly weaker than Hurricanes Katrina and Rita, which caused so much damage back in 2005, resulting in 9+ million gallons of oil spilled from coastal and offshore facilities. Hurricanes Gustav and Ike in 2008 also caused problems, blowing drill rigs around the Gulf and flooding coastal oil storage tanks and wells. So we’ll be keeping a close eye on Isaac in coming days.
These maps show the latest forecast from NOAA / National Weather Service. The dark line is where forecasters predict the center of the storm is most likely to pass (the “storm track”); the purple area is the cone of uncertainty for that track. Orange dots and lines are offshore oil and gas platforms and pipelines.
NOAA/NWS forecast storm track for Isaac, August 26, 2012 (Advisory #22). Orange dots and lines are offshore oil and gas pipelines and platforms.
Detailed view: NOAA/NWS forecast storm track for Isaac, August 26, 2012 (Advisory #22). Orange dots and lines are offshore oil and gas pipelines and platforms.
https://skytruth.org/wp-content/uploads/2012/08/SkyTruth-Isaac-26aug2012-forecast-platforms.jpg349640John Amoshttps://skytruth.org/wp-content/uploads/2020/11/SkyTruth-Header-Logo-C.pngJohn Amos2012-08-26 21:13:002023-01-18 16:31:54Tropical Storm Isaac Heading for Gulf of Mexico
Wide view of Shell’s drilling areas in the Chukchi and Beaufort Seas off the north slope of Alaska
Since then, we have been monitoring the changing sea ice using data published by the National Ice Center at NOAA. The sea ice extent varies dramatically from winter to summer, and even the daily variations can be substantial.
This graph that we got from the Danish Meterological Institute shows the average Arctic ice coverage over the course of the year, in millions of square kilometers. As you can see, August (01/08) marks the beginning of the part of the year with the least ice coverage; the lowest being through the month September (01/09). The black line indicates this year (2012).
Shown below are a series of sea ice maps from the National Ice Center covering the last three weeks. The large white portions represent thick ice coverage, the grey is thin or broken up ice. Red squares show lease blocks which could be potentially drilled. The yellow points are Shell’s planned drilling locations.
Images showing recent weekly change in sea ice coverage in the vicinity of Shell’s planned offshore drilling sites.
As you can see, even this far into the summer season, Shell’s planned drilling sites are still impacted by sea ice, and the ice coverage is still changing drastically from week to week. We shudder (or shiver) to think what it would take to mobilize an oil spill response on the scale of the response to BP’s 2010 disaster in these icy, unpredictable conditions.